Improving build times is a hot topic in mobile development. As user expectations and product needs for mobile apps get ever higher and the number of common libraries and dependencies grows, build times naturally creep up. Add to that the unit tests, linting, static analyzers, and various other build steps teams cram into their CI pipelines, and it’s not surprising that this topic shows up on mobile development forums often.
While automatically building on a CI server allows your team to focus on other things, there are still repercussions for slow builds. The longer it takes for builds and automated tests to run, the longer it takes your team to confidently develop new features and fix problems. If your engineers have to wait 30-40 minutes just to discover that their build is broken, they’re losing valuable time that could be spent improving your app.
In this piece, we’ll share some of the more advanced tips for improving Android build times. Because every particular project comes with its own complexities and unique challenges, it’s impossible to offer universal advice, but we hope to highlight a few approaches you might not have explored before.
Using the Gradle build cache
You are likely already familiar with Gradle, since it’s the most popular build tool for Java and Kotlin Android developers. So, let’s start there!
The Gradle build cache allows you to reuse build outputs to save time on subsequent builds. One of its nicest features is that it can work across different machines or even remotely, allowing one developer to build and other developers (or CI machines) to leverage their cache. Ultimately, this leads to faster feedback for developers and less money spent on CI resources.
Gradle supports both <code>local<code> and <code>remote<code> build caches, and they can be configured separately. When both build caches are enabled, Gradle tries to load build outputs from the local build cache first. If no build outputs are found, Gradle tries the remote build cache and stores the results in the local cache to speed up subsequent builds.
Enabling the local build cache
One important thing to be aware of is that build caching is opt-in - it’s not enabled by default. You can enable it by using the <code>--build-cache<code> flag or by adding <code>org.gradle.caching=true<code> to your <code>gradle.properties<code>.
Next, you can configure your local build cache in <code>settings.gradle<code>, defining the <code>buildCache<code> block inside <code>Settings.buildCache(org.gradle.api.Action)<code> (For more details, see documentation for local build cache).
By default, Gradle stores local cache outputs in your home directory, but you can change the target location by specifying the <code>directory<code> explicitly:
// settings.gradle.kts
buildCache {
local {
isEnabled = true
directory = File(rootDir, "build-cache")
removeUnusedEntriesAfterDays = 30
}
}
And don’t forget to add the folder of cached builds to your <code>.gitignore<code> file, as cached builds shouldn’t be checked into version control!
Enabling the remote build cache
A remote build cache allows all of your team members and CI machines to access a shared cache. This speeds up everyone’s builds, even if it’s the first time they’ve built the app on their machine. To enable remote caching, you can use one of the cache nodes provided by Gradle Enterprise (a premium service), or you can host your own remote cache node.
Use the <code>remote<code> block inside your <code>buildCache<code> settings to specify your shared remote cache location and to store your login credentials:
// settings.gradle.kts
buildCache {
remote<HttpBuildCache> {
url = uri("https://yourRemoteCache.com:8123/cache/")
credentials {
username = "build-cache-user"
password = "some-complicated-password"
}
}
With this workflow, your CI server will typically populate the cache from a clean build, and developers will load it locally. This prevents developers with unconventional local build settings from pushing breaking changes up to the cache.
Splitting code into modules
For a long time, multi-module projects were discouraged in Android development because they caused scalability issues in Gradle. Adding more modules would once slow down your builds to an unusable degree. But now, after some major improvements from Google, multi-module projects are recommended.
Modularizing an existing app is easier said than done, but once you get it done, the payoff can be significant. Broadly speaking, there are two ways to modularize an Android app: by feature or layer. Once you decide which method makes the most sense for your use case and break out your app accordingly, you can start compiling modules individually rather than compiling the entire app at once.
Avoiding recompilation
Before Android Gradle plugin version 3.0, you had to apply dependencies using the <code>compile<code> configuration. If any code changed in one module, every other module depending on it also needed to be recompiled — even if the code in question would have otherwise had no dependency impact.
Gradle solved this problem by introducing an Application Binary Interface (ABI). In simple terms, ABI includes only the public methods and fields that can be invoked or accessed from outside the module in question. If a change to your code changes something in the ABI, Gradle will recompile, but otherwise changes that don’t affect the ABI are safely ignored.
More recently, Gradle has deprecated the <code>compile<code> keyword entirely in favor of either <code>api<code> or <code>implementation<code> for dependency resolution. When you are using <code>implementation<code>, you are consuming each dependency as an implementation detail, but consumers don’t have access to the consumed module’s dependencies. When using <code>api<code>, you are basically opting into the old method of compiling the whole dependency chain with each build.
This leads to a trade-off between convenience and performance. You might be tempted to use <code>api<code> because it’s more forgiving, but it’s really easy to end up with cyclical and leaked dependencies. <code>implementation<code> is also faster than <code>api<code>, so if performance is what you’re after (which we assume it is, given you’re reading this article!), that’s another important factor to consider.
If you do end up breaking your dependency graph with the wrong mix of <code>api<code> and <code>implementation<code> configurations, the Dependency Analysis Gradle Plugin can help you track down unused and transitive dependencies.
Parallel project execution
Even with decoupled modules, Gradle will only run one task at a time by default. With most desktop and CI servers having extra CPU cores available, enabling parallel execution is one of the best ways to improve build performance.
With parallel project execution enabled, the compiling is done on-demand for multiple modules at the same time. Gradle can even reuse the configuration for unchanged projects and use pre-built artifacts in dependencies.
To enable parallel execution once, use the <code>--parallel<code> flag in the command line. To make building in parallel the default behavior for your project, add the following to your <code>gradle.properties<code> file:
//gradle.properties
org.gradle.parallel=true
Reducing local build times with Mainframer and Mirakle
Even if you have performant hardware building your app and even if you’re running builds in parallel, having hundreds of Chrome tabs open and using resource-intensive IDEs can greatly reduce the availability of your system resources. This may ultimately impact local build times.
Using a tool like Mainframer or Mirakle might be a good way to mitigate this. Tools like these allow you to offload the building of your app to a remote machine over SSH and see the final results when the build is done. Both tools copy your local app folder with any changes (such as edited source files) to the executor, run the build, and then copy the remote changes (including the compiled APK) back to your development machine.
Obviously, this doesn’t help with slow builds on your CI server, but it could be a good short-term solution to sluggish local builds, especially for team members with older equipment.
Low-level profiling
Sometimes, slower builds have nothing to do with your build scripts, but are caused by inefficient plugins, custom tasks, or constrained system resources. The best way to find these bottlenecks is to introduce code-level profiling to help you measure before you optimize.
There are a few tools out there that can help you start profiling your Android app’s source code:
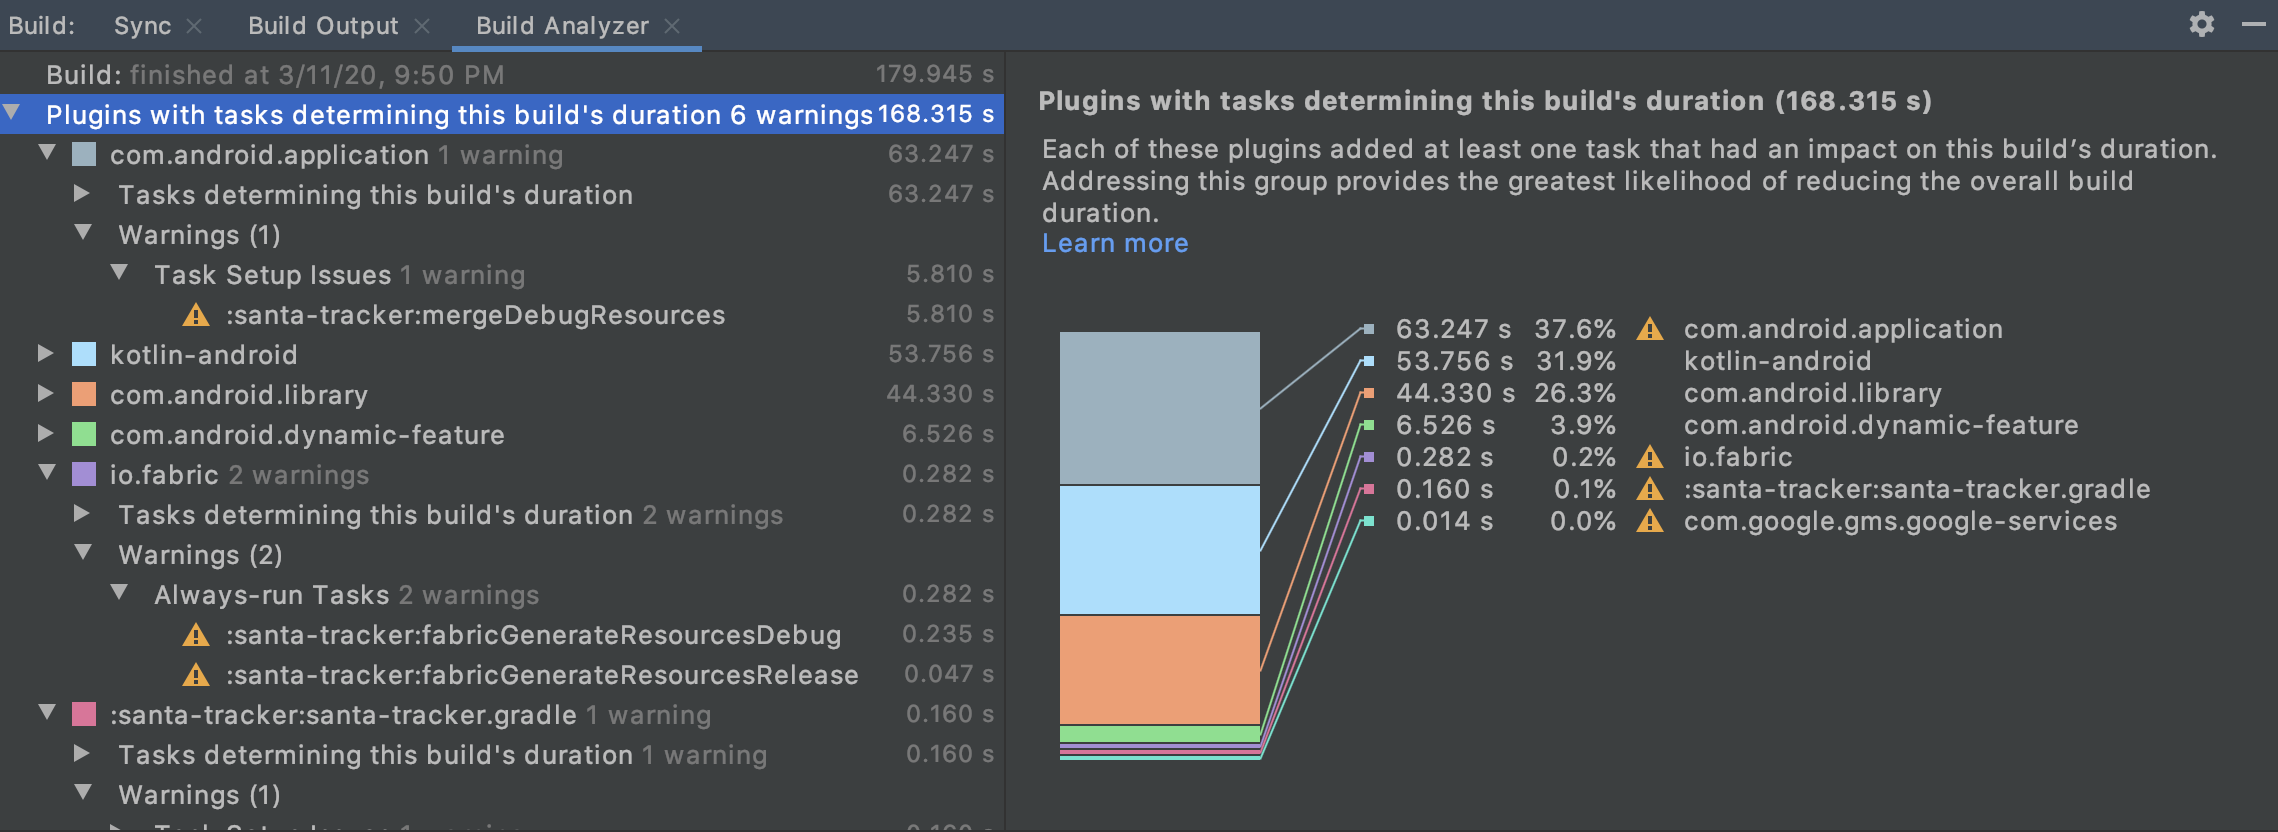
1. Android Studio Build Analyzer
Build Analyzer helps you understand the factors involved in your total build time so you can spot plugins and tasks that might be slowing down your project. This is especially useful in large, complex builds where small changes can have wide-ranging downstream impacts.
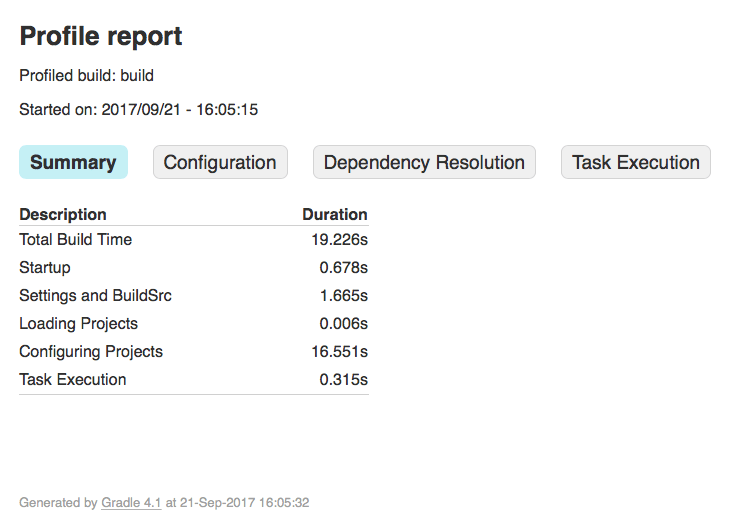
2. Gradle Profiler plugin
Gradle Profiler is a standalone tool for running benchmarks and profiling your Gradle builds. It allows you to create different build scenarios and then repeat them to ensure that your performance is consistent on every run. This can help you catch occasional slow builds, which are often the hardest to track down.
Gradle Profiler has a “benchmarking mode” that lets you collect information about incremental builds at a high level, and a “profiling mode” to collect more granular CPU and memory data about each run.
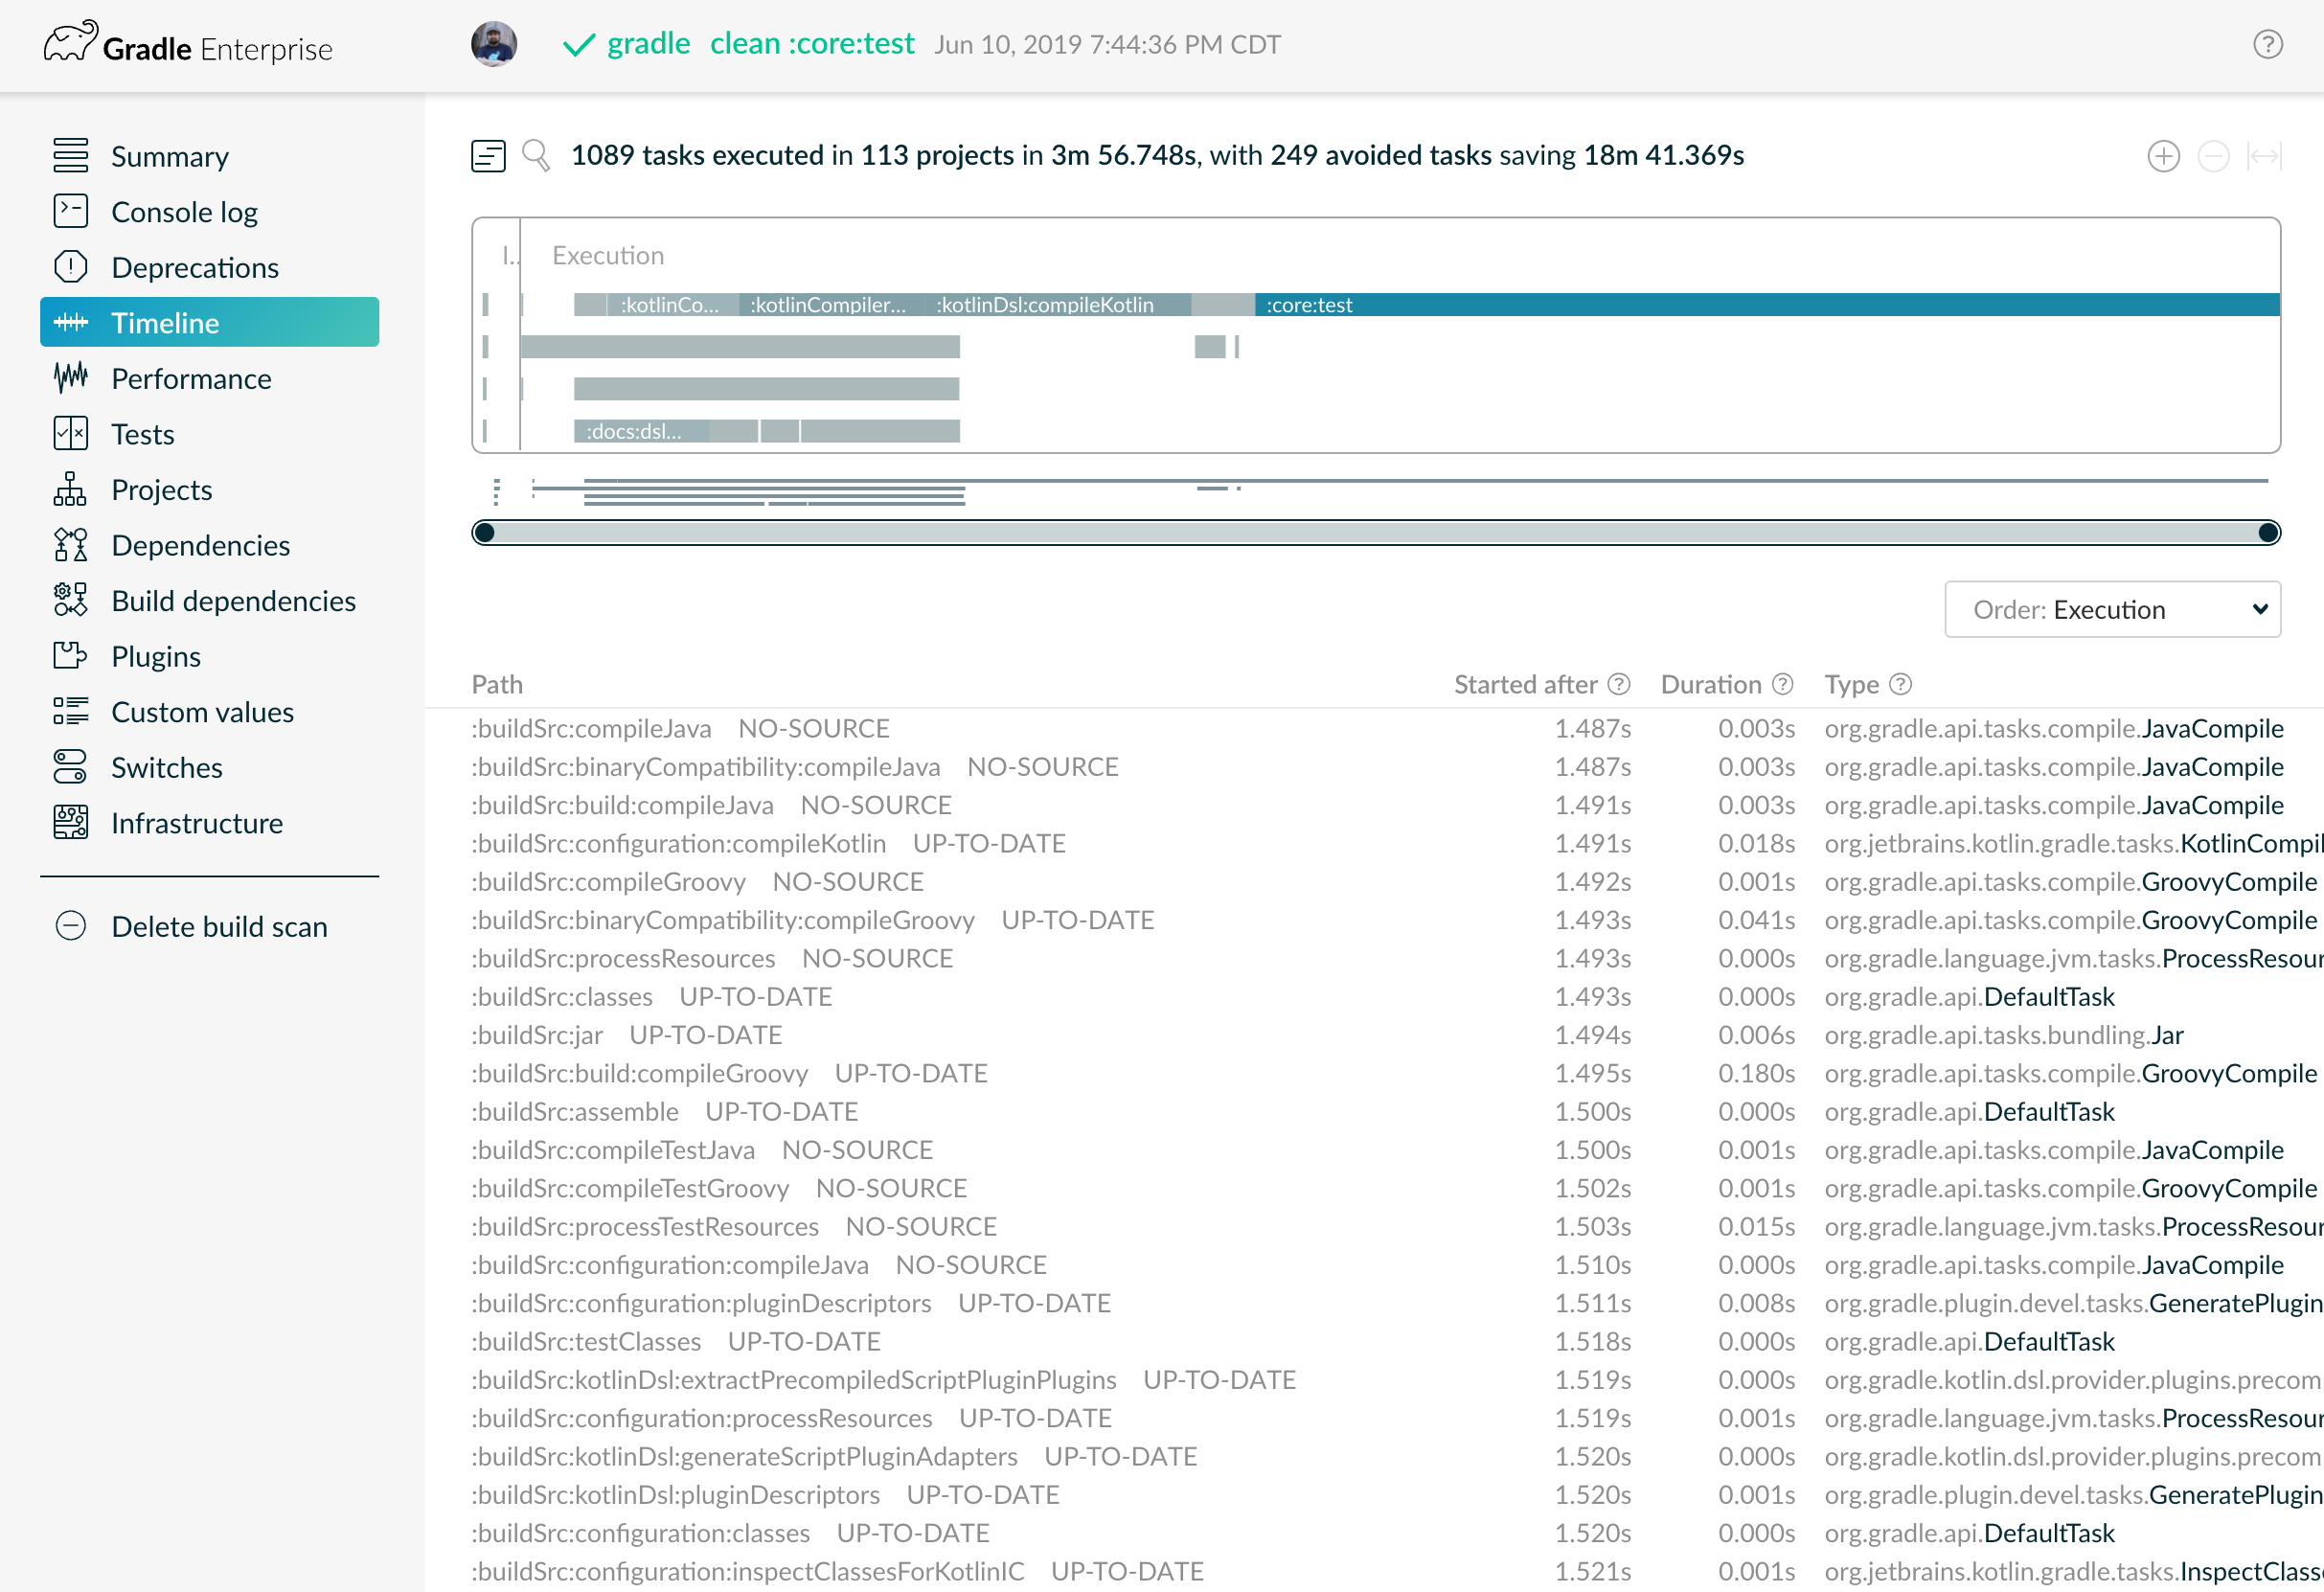
3. Gradle Enterprise Build Scans
Build Scans provide a more detailed accounting of your build than the previous options, but they require a Gradle Enterprise subscription. Also note that they’re not an offline solution: whenever you run a scan, the report is published to <code>scans.gradle.com<code> so it can be shared with other members of your team.
These detailed reports let you see each task during your build and how it contributed to your build’s overall performance. You can drill down to see the dependencies involved and look at how each plugin is impacting your build time.
Profiling is almost always a good idea if you’re looking to improve your Android build times, but you’ll eventually reach a point of diminishing returns. After taking care of any low-effort, high-value improvements, you might just find that some Gradle tasks simply don’t need to be run on every build. Which leads us to…
Skipping Gradle tasks
It’s often easier to design builds such that every step or task runs every time, but this isn’t always necessary. For example, if you just want to run your linter, you don’t need a complete production build. Or, you might run your unit tests on staging builds, so you’re able to skip them on release builds. Whatever the case, skipping a task altogether is obviously faster than even a cached task!
There are several ways you can instruct Gradle to skip a task:
1. Using the <code>onlyIf<code> predicate
While writing a custom task, you can use <code>onlyIf<code> to opt out of the task if certain criteria are not met:
task.register("hello") {
onlyIf {
!project.hasProperty("skipHello")
}
}
The task above will not run if you pass <code>skipHello<code> as a parameter from your command line:
$ gradle hello -PskipHello
The <code>onlyIf<code> predicate might be helpful if you want to allow each different CI environment to use different rules governing the tasks that should run, or if you want developers working locally to have granular control over their local build process.
2. Using <code>StopExecutionException<code>
If an exception is thrown by a task, you might want to skip this task and stop all future tasks completely. This will ensure that a long-running build doesn’t continue monopolizing CI server time if other builds are waiting for it to finish first.
val taskA1 by tasks.registering {
doLast {
println("this is task A1")
}
}
val taskB1 by tasks.registering {
dependsOn(taskA1)
doLast {
println("this is task B1")
}
}
taskA1 {
doFirst {
throw StopExecutionException()
}
}
The above code will only output <code>this is task B1<code> as A1 throws a <code>StopExecutionException<code>.
3. Skipping (or continuing) when tasks timeout
By default, tasks that time out will be marked as failed, and subsequent tasks will stop running. But, if you use the <code>--continue<code> flag, other tasks will continue running even after a timeout. This can be useful if an external server your integration tests rely on goes down. In this case, the integration tests will still time out, but you can at least understand whether your unit tests passed or not.
4. Disabling a task
By default, every Gradle task has an <code>enabled<code> flag set to <code>true<code>. Setting this flag to <code>false<code> allows you to skip specific tasks if needed. This can be useful for debugging tasks individually or running them only in specific CI environments.
val disabledTask by tasks.registering {
enabled = false
doLast {
println("I'm disabled task!")
}
}
Another option for skipping a single task without modifying any Gradle files is to use the -x command line option. To exclude a task called <code>counter<code> from your build, simply run:
./gradlew build -x counter
Or exclude multiple tasks like this:
./gradlew build -x counter -x hello
Using Bazel as your build system
There comes a point at which you simply reach the limits of what Gradle can do. When this happens, you might want to explore using an entirely new build system. Bazel has been used internally by Google to build the majority of their apps, and it supports projects with multiple languages and build targets. Because it was specifically designed to support large codebases running across multiple repositories, and with many contributors, it is inherently more scalable than Gradle.
By caching all previous work and tracking changes to files and build commands, Bazel can understand when each piece of code needs to be rebuilt and thus minimize recompilation. It also supports parallel and incremental builds that tend to be more reproducible than Gradle’s. Finally, Bazel can handle hundreds of thousands of source files and it works across multiple repositories and userbases.
One of the key differences between Gradle and Bazel is that Bazel generates many smaller targets. This means that changes in each target won’t have as much of an impact on the dependency tree, resulting in less frequent rebuilds with Bazel. The smaller target sizes also means you can more easily take advantage of parallelism. Plus, with Bazel, you can spawn a much larger worker farm compared to Gradle.
While changing your build tool is a big undertaking, it definitely makes sense in some cases. For example, if your codebase has over 50 modules, has significant test coverage, and is maintained by several teams, Bazel is likely worth the investment. If you’re interested in learning more, be sure to check out Chip Dickson and Charles Walker’s talk on migrating from Gradle to Bazel at BazelCon 2019.
Conclusion
Most teams don’t think much about their Android app’s build performance until it becomes a problem, but it should be more than an afterthought. Build times directly affect server costs and the amount of time required to ship new app updates — not to mention your team’s overall productivity and happiness.
If your team hasn’t already, it’s worth exploring some of the options we’ve covered above, such as optimizing Android build times with Gradle, implementing finer control over which tasks are run during builds, and using profiling tools to gain insights into performance bottlenecks.
Optimizing Gradle can take you a long way, but you might also find that you outgrow it at some point. If you do, alternatives like Bazel are likely worth the cost of switching. New tools are constantly cropping up, so be sure to let us know if you’ve got others we should try!


