Mobile releases have become a massive productivity drain hiding in plain sight. Our data reveals mobile engineers spend nearly a third of every release cycle—an average of 5 hours per release—on busywork that adds negligible value to the product or user experience. This isn't just an engineering problem; it's a business crisis directly impacting your ability to compete and innovate.
Figure 1: Most frustrating aspects of the mobile release process
For mobile teams, this translates to chronic frustration, burnout risk, and and release dread from more time spent coordinating releases than building features users actually want. Manual steps, constant context switching, and coordination overhead create a perfect storm that pulls your best developers away from their core strengths.
From a business perspective, this efficiency gap represents millions in lost opportunity cost. When your mobile app drives revenue and customer engagement, every hour spent on release busywork is an hour not spent on features that could differentiate you in the market. Below, we'll break down the true scope of this mobile tax, why firefighting has become normalized across 86% of teams, and how release complexity scales dramatically as organizations grow.
Top frustrations for mobile teams
Manual steps (49%) top the list of frustrations, confirming that one of the biggest pain points for engineers is spending precious coding time on repetitive administrative tasks rather than building features that drive business value and delight users.
The unholy trinity of manual steps (49%), context switching (42%), and cross-functional coordination (41%) creates a perfect storm that pulls engineers away from their core strengths. For practitioners, this represents a hidden productivity tax that compounds with each release cycle, directly contributing to burnout risk.
Mobile teams recognize these problems and often try to automate them, but as we'll see in later findings, automation alone doesn't solve these core coordination challenges. You can't just script your way out of human communication problems.
What's particularly revealing is how close all these frustration points are in the rankings. The fact that there isn't one clear dominant pain point that could be easily solved with a single tool or approach reflects an underlying complexity involving human communication, coordination, and process challenges across the organization—illustrating why simply automating manual work isn't a complete solution.
*Question allowed more than one answer and as a result, percentages may add up to more than 100%.
The 5-hour productivity drain
On average, mobile engineers spend 5 hours per release on non-productive or low-value tasks—manual steps, coordination issues, approval bottlenecks, and other busywork that doesn't move the product forward.
Figure 2: Average: 5 hours. Average time spent on non-productive or low-value tasks per release.
Let's put that in perspective: Assuming a biweekly cadence, five wasted hours every two weeks translates to 130 wasted engineering hours annually. That's more than 3 full engineering weeks lost to process inefficiencies instead of building features that users actually care about.
Moreover, while most teams hover around that 5-hour average, a substantial 37% report spending 6-10 hours per release on non-productive tasks. For these teams, process waste is actively eroding shipping velocity, developer satisfaction, and ultimately, user experience. There's a massive opportunity for efficiency gains hiding in plain sight.
More automation, more process waste?
Whether you've thrown substantial resources at automation or barely automated at all, you're likely experiencing similar inefficiencies. It's clear that automation alone isn't addressing the fundamental release coordination challenges.
Among teams that spend 6-10 hours per release on low-value work (Figure 2), half (50%) have invested significantly in automation, as seen in Figure 3. This highlights a critical misconception—more automation doesn't automatically create a more mature release process. In fact, automation often creates a false sense of security while coordination overhead and pre-rollout work continues to drain productivity.
Figure 3: "6-10" hours by app release cadence and automation investment
Conversely, the second most common group reporting high inefficiency has made little to no automation investment (43%). This creates a puzzling picture: whether you've thrown substantial resources at automation or barely automated at all, you're likely experiencing similar inefficiencies. It's clear that automation alone isn't addressing the fundamental release coordination challenges.
The stark contrast between biweekly (44%) vs monthly (30%) releases reveals how increased release frequency creates exponential coordination challenges without proper tools—limiting how fast teams can effectively release.
Traditional automation alone cannot solve the fundamental coordination and visibility issues that slow engineering teams as releases become more frequent. It's like trying to fix a communication problem by installing more phones—the tools aren't the issue, it's how they work together.
{{cta}}
1/3 of every release cycle is burned on low-value busywork
On average, respondents personally spend a third (32.5%) of each release cycle on non-productive or low-value tasks such as manual steps, approval bottlenecks, coordination issues, and other busywork.
Figure 4: Percentage of time spent on non-productive or low-value tasks during a release cycle.
With mobile apps becoming critical revenue channels, this 32.5% efficiency gap directly impacts business agility. Mobile teams who recognize and address this can recover significant capacity for innovation, develop features that directly impact user experience faster, and increase their competitive advantage.
This data provides a clear benchmark for teams to assess their own release efficiency. Those operating above the 32.5% average have an urgent opportunity to improve DevEx and shipping velocity by centralizing and streamlining their release coordination. Think of it as a tax refund waiting to be claimed—what could your team build with nearly a third more engineering capacity?
Firefighting is the new normal
The majority of respondents (77%) report that incidents leading to delayed features or hotfixes occur often (about once every 3 to 5 releases) and 9% report that they occur frequently (every other release). Let's be blunt: Most teams (86%) spend a significant amount of time firefighting instead of building features, wasting precious feature-work resources.
Figure 5: Frequency of incidents leading to delayed features or hotfixes.
These frequent disruptions are a productivity drain that most organizations have normalized rather than solved, directly impacting their ability to meet product roadmap commitments. It's the mobile engineering equivalent of Stockholm syndrome—teams have come to accept this cycle of crisis as normal.
It also means that developers are trapped in perpetual crisis mode, unable to break free from reactive work to focus on innovation. This leads to burnout, reduced job satisfaction, and ultimately talent retention challenges. It creates a vicious cycle where quality suffers due to constant firefighting, leading to even more incidents.
Most teams (86%) spend a significant amount of time firefighting instead of building features, wasting precious feature-work resources.
This data quantifies a critical business risk: when nearly 1 in 4 releases experiences problems severe enough to delay features or require hotfixes, user trust and revenue are directly impacted in a market where mobile is increasingly the primary customer channel.
Risk scales with company size
As your mobile operation grows, the inefficiencies in your release process become increasingly painful and eventually emerge as your greatest risk factor.
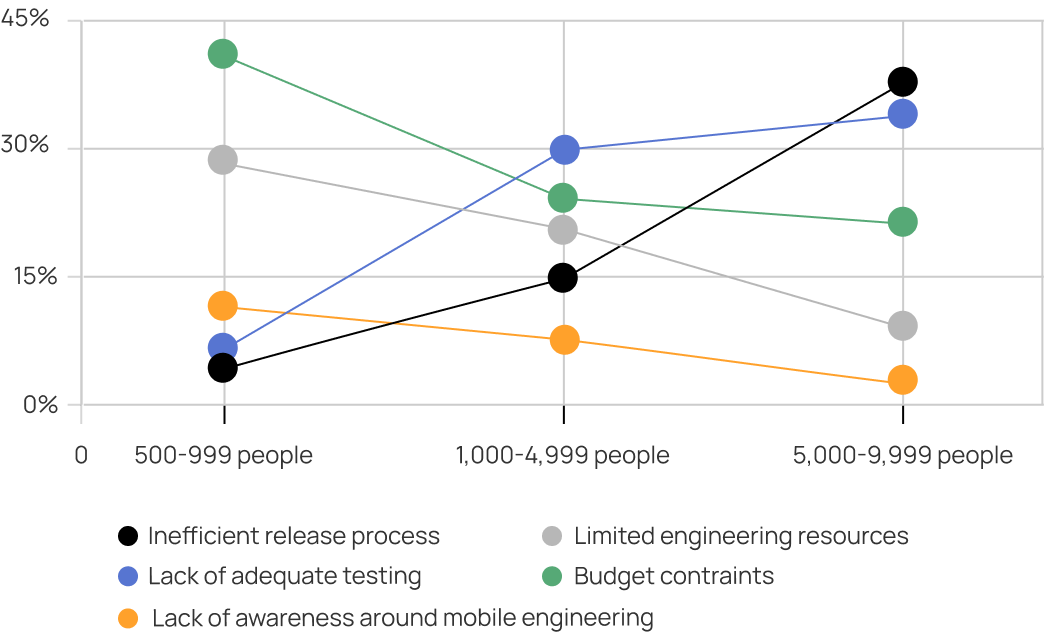
Companies face twice as much risk in their mobile app release process as they get bigger. This pattern appears when companies grow from 500 to 1,000 employees, and again when they grow from 1,000 to 5,000 employees. For enterprise companies (5,000+ employees), inefficient release processes become the dominant concern (34%), outranking both budget constraints and resource limitations that were top priorities at smaller scales.
Figure 6: Greatest risk to the mobile team's success and scalability.
For smaller companies (500-999 employees), budget constraints and engineering resources are the top concerns, reflecting the resource limitations these teams face in their early growth stages.
As companies enter the mid-size range (1,000-4,999 employees), we begin to see a shift where resource concerns remain important but inefficient release processes gain prominence, showing how teams start feeling the pain of early technical and process debt.
This progression tells a compelling story: you can afford to do things that don't scale when you're smaller, but as your mobile operation grows, the inefficiencies in your release process become increasingly painful and eventually emerge as your greatest risk factor. It's the technical debt of mobile DevOps—what works at a smaller scale becomes unbearable as you grow.
Missing deadlines: Inefficient releases impact your roadmap & users
The data clearly shows that status quo releases waste time and resources, create anxiety, and result in a lower standard of work reaching users—yet teams aren't making the connection.
While most teams understand that release-related incidents negatively impact deadlines and quality, many don't immediately connect the dots between release inefficiency and these negative outcomes.
When asked how likely inefficiencies in their current release process could lead to missed deadlines, delayed features or negative user impact, most respondents indicated that this is somewhat unlikely (43%) or very unlikely (9%). 31% of respondents remain neutral, and only 17% believe it is somewhat likely that inefficiencies in their current release process would lead to such issues.
Figure 7: Likelihood of missed deadlines, delayed features, or negative user impact due to inefficiencies in the release process.
This reveals a major blind spot for mobile teams. The data clearly shows that status quo releases waste time and resources, create anxiety, and result in a lower standard of work reaching users—yet teams aren't making the connection.
The fact that most respondents do not see a strong risk of negative outcomes due to release inefficiencies is inconsistent with other findings in the report. After all, 86% of mobile engineering teams acknowledge that release-related incidents lead to delayed features or hotfixes either often or frequently (Figure 5). This disconnect suggests teams have accepted and normalized inefficiencies as the status quo, with incidents and hotfixes becoming an expected part of the development cycle rather than exceptional events that should be addressed systemically.


.png)
.png)
.png)